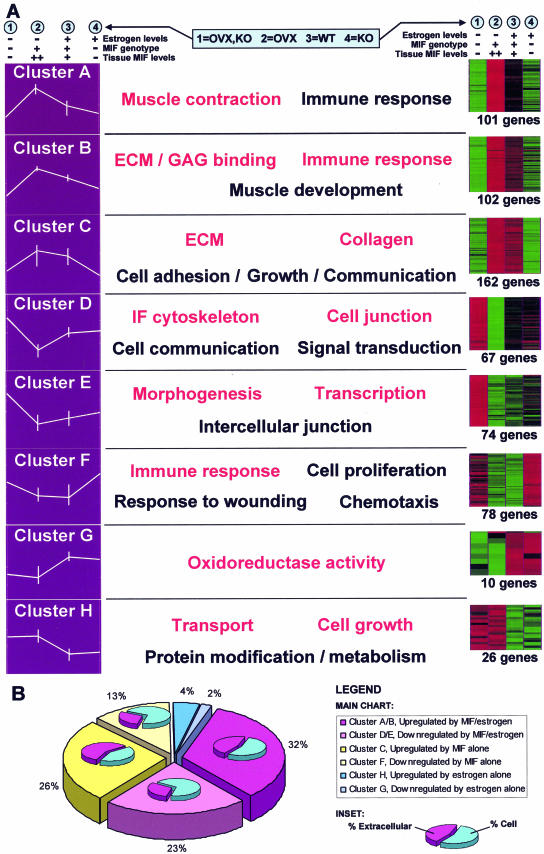
Figure 2.
Clusters, profiles, and GO groupings. A: Identified genes were assigned to one of eight distinct clusters using k-means clustering algorithms. On the left, the data for each cluster are represented as a profile of the z-transformed (for each probe set, the mean set to 0 and SD to 1 using maxdView), log (2) values for the mean of each experimental group/condition. Error bars indicate the maximum and minimum values within each group. Displayed on the right is the same z-transformed data shown as an Eisen color plot. The number of genes in each cluster is specified. Red and green indicate positive and negative change from zero, respectively, with color intensity indicating the degree of deviation. The most significantly overrepresented GO terms are shown for the genes within each cluster. Terms in red have the highest statistical significance. B: Graphical representation of the number of genes within each cluster. This highlights the minimal involvement of estrogen alone in healing (blue) with the majority of estrogen’s effects acting through MIF (pink). Subcharts indicate the percentage of extracellular and cellular genes in each cluster. Clusters containing genes up-regulated by MIF levels (clusters A/B and C) are characterized by considerable overrepresentation of extracellular genes.

