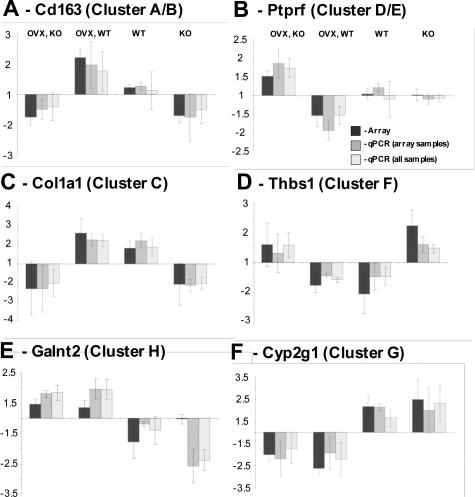
Figure 3.
Validation of array data by quantitative real-time PCR. Six representative comparisons from a total of 26. A: Cd163, a gene up-regulated by MIF with OVX interaction. B: Ptprf, down-regulated by MIF with OVX interaction. C: Col1a1, up-regulated by MIF alone. D: Thbs1, down-regulated by MIF alone. E: Galnt2, down-regulated by estrogen independently of MIF. F: Cyp2g1, up-regulated by estrogen independently of MIF. qPCR (array samples), real-time PCR on the same three mice per group used for arrays; qPCR (array samples) used five mice per group. To enable direct comparison, all three datasets were normalized to give a mean of 1 and values below 1 converted to negative-fold change. The y axis indicates fold change from the mean. Error bars indicate ±SEM.

