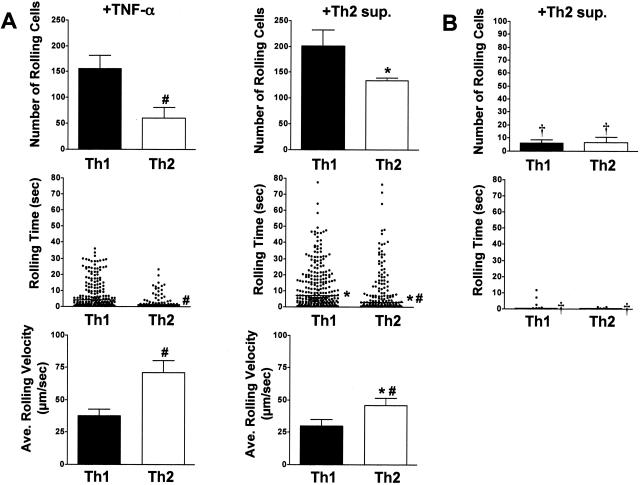
Figure 3.
Activated Th2 cells produce soluble factors that stimulate enhanced recruitment of Th1 and Th2 cell rolling on MAECs. A: Th1- and Th2-polarized cells were derived from wild-type DO11.10 mice as in Figure 2, labeled with 2 μmol/L Cell Trace calcein red-orange, AM (Th1), or calcein, AM (Th2), mixed at a 1:1 ratio and flowed over MAECs with a shear stress of 0.5 dynes/cm2. MAECs were stimulated for 6 hours with Th2 supernatant. Data collection and analyses were performed as in Figure 2, and are from one of two representative experiments. Error bars indicate SEM. In the middle panel, rolling time data are pooled from four fields of view for each condition. Data in the bottom panel represent the average rolling velocity and SEM from four fields of view. #Indicates statistical significance between T-cell subtypes. *Indicates statistical significance between methods of endothelial cell stimulation. P < 0.05. B: Th1- and Th2-polarized cells were derived from DO11.PSGL-1−/− mice as in A, and rolled on Th2 supernatant-stimulated MAECs as above. Data in the top panel are expressed as the percentage of rolling wild-type (DO11.PSGL-1+/+) control cells. Error bars indicate SEM. †Indicates statistical significance between genotypes (P < 0.05).

