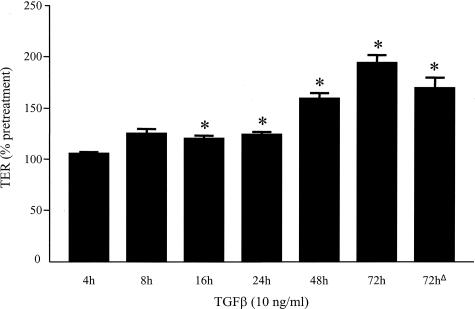
Figure 1.
Bar graph showing increased TER across T84 cell monolayers after continuous TGF-β treatment (10 ng/ml, 4 to 72 hours) or after a 1-hour pulse with cytokine (denoted as 72hΔ). TER values were recorded before cytokine treatment for comparison against values at the end of each time point (indicated as percent pretreatment value), and these were compared against naïve, time-matched controls (mean ± SEM, *P < 0.05, n = 3 to 10 monolayers). Pretreatment TER values were 609 ± 189 Ω·cm2 and 607 ± 158 Ω·cm2 for naïve controls and pre-TGF-β treatment, respectively.

