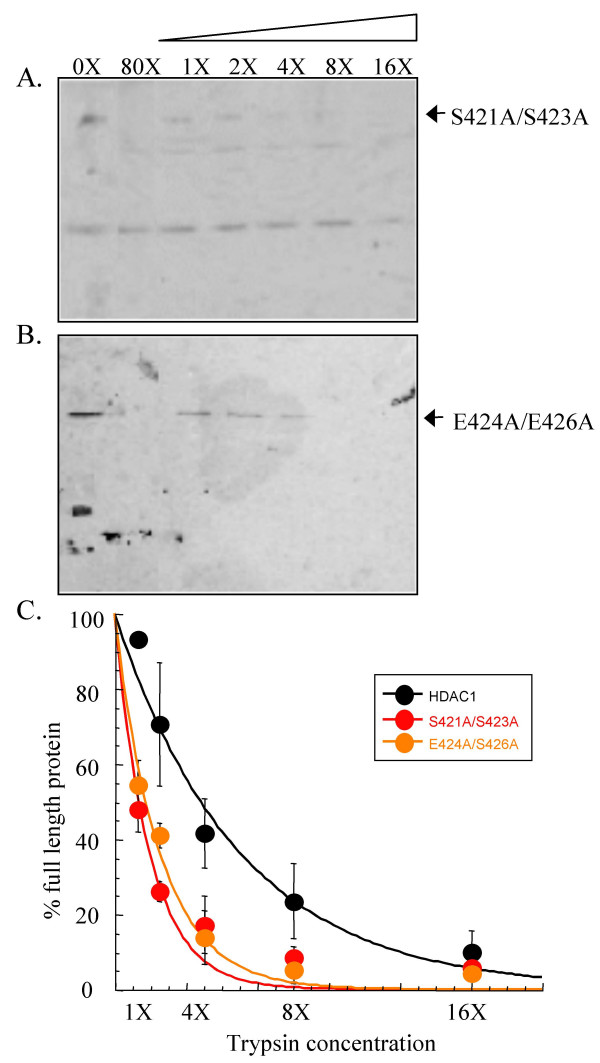
Figure 3.
Limited proteolysis of HDAC1 S421A/S423A and HDAC1 E424A/E426A mutants. Immunoprecipitated HDAC1 S421A/S423A (A) and HDAC1 E424A/E426A (B) mutants were incubated with increasing concentrations of trypsin (see Figure 1), separated by SDS-PAGE, and visualized with anti-Flag antibody. The faster migrating proteins present in the absence of trypsin (0X) are derived from the anti-Flag-bound solid phase used for immunoprecipitation [see Additional File 3]. (C) A graph showing percentage of full length S421A/S423A mutant (red) and E424A/E426A mutant (orange) remaining after exposure to different concentrations of trypsin. The data with wild type HDAC1-F (black- Figure 1) is also included for comparison. The curves were generated by least squares fit to a single exponential.

