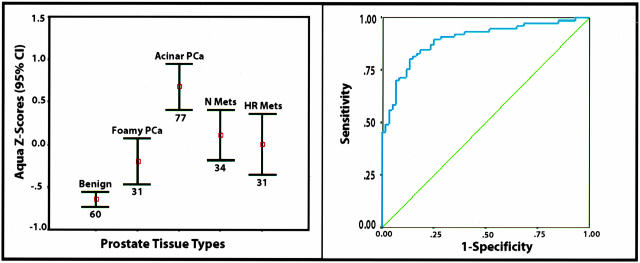
Figure 4.
Evaluation of normalized AMACR-AQUA scores and ability to predict the presence of prostate cancer. The AQUA results were normalized creating an AMACR AQUA Z-score (left). Expression results demonstrate measurable levels of AMACR in the foamy gland tumor population that are statistically significantly higher than the benign prostate tissue population as demonstrated by nonoverlapping error bars with 95% confidence intervals. A ROC plot demonstrates the sensitivity and specificity of using an AMACR AQUA Z-score to diagnose prostate cancer in an unsupervised manner (ie, without previous review by a pathologist) (right). The area under the ROC curve is 0.90 (P < 0.00001; 95% CI, 0.84 to 0.95). An area under the curve of 1.00 represents perfect discrimination of the test to predict prostate cancer and 0.50 no discriminatory power.

