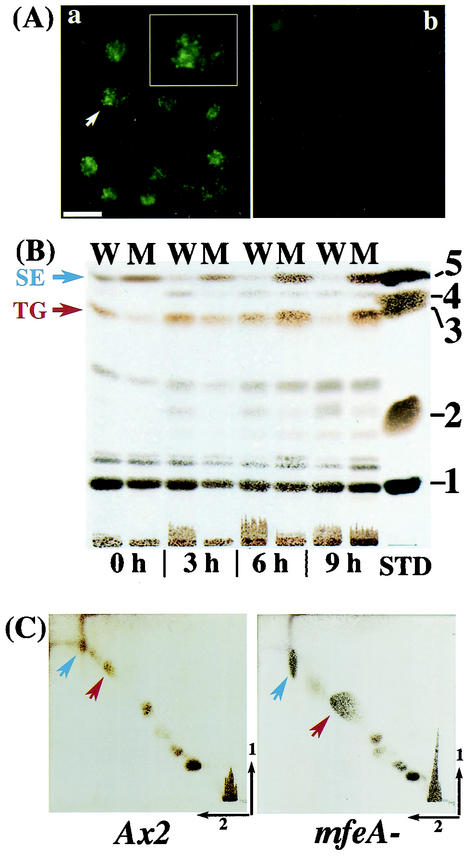
FIG. 6.
Lipid analyses. (A) Lipid droplets in the bacterially grown mfeA-null (a) and wild-type (b) cells were visualized with Nile red. Inset in panel a shows higher magnification of a single point with a white arrow. Scale bar: 20 μm. (B) TLC of total lipids in wild-type (W) and mfeA-null (M) cells after various periods of bacterial cultivation. Lipid moieties were visualized as described in Materials and Methods. The standard lipids (STD), cholesterol oleate (1), methyl oleate (2), triolein (3), oleic acid (4), and cholesterol (5) were tested. (C) Two-dimensional TLC of total lipids extracted from Dictyostelium cells cultivated for 24 h on an E. coli lawn. Left panel, wild-type cells; right panel, mfeA-null cells. Blue arrows, SEs; red arrows, TGs.

