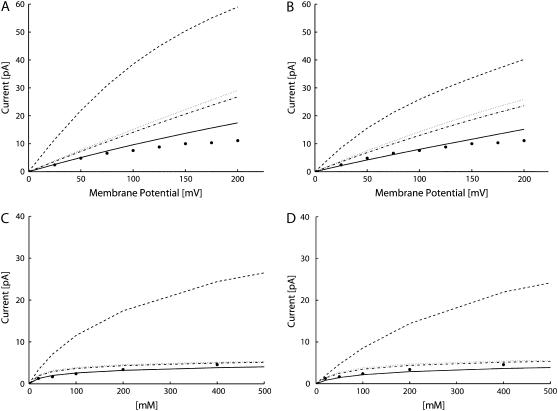
FIGURE 3.
Computed currents varying the diffusion coefficients, D: D was set at the bulk value in the whole system (dashed line); D was reduced to 10% of bulk in SF (dotted line); D was reduced to 10% in SF and to 50% in IC (dot-dashed line); and D was reduced to 10% both in SF and IC (continuous line). Experimental data by LeMasurier et al. (35) (•). (A) Current-voltage characteristic with ion concentrations set at 100 mM in Model I. (B) Current-voltage characteristic with ion concentrations set at 100 mM in Model II. (C) Current-concentration characteristic with membrane potential set at 25 mV in Model I. (D) Current-concentration characteristic with membrane potential set at 25 mV in Model II.

