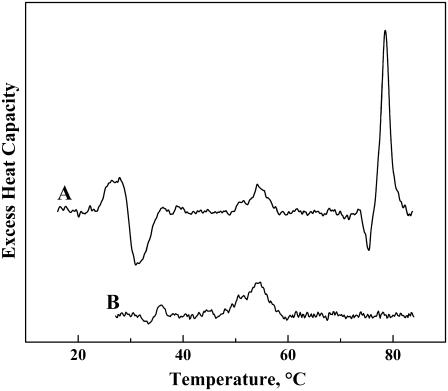
FIGURE 11.
Representative DSC thermograms observed upon heating aqueous dispersions of crystalline lanosterol. The thermograms shown were obtained by heating samples containing 2–3 mg of lanosterol in a Calorimetry Sciences Multi-Cell instrument at scan rates near 56°C/h. The thermograms shown exemplify the type of behavior observed upon initial heating (A) and subsequent heating (B).

