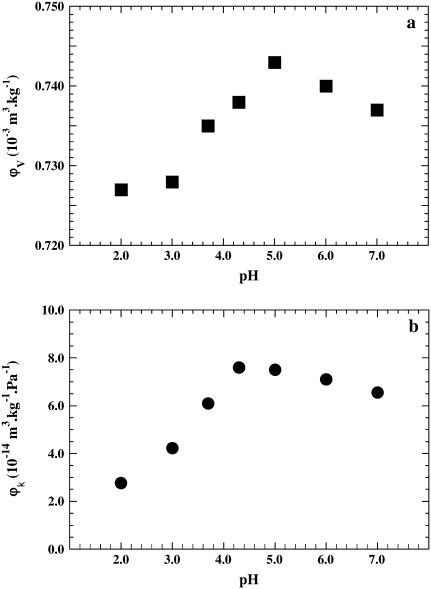
FIGURE 1.
(a) Plot of ϕv, the apparent partial specific volume of BSA, as a function of pH. The standard deviation in volume measurements is ±0.003 × 10⁻³ m3 kg−1. (b) Plot of the partial specific adiabatic compressibility ϕk as a function of pH. The standard deviation in compressibility measurements is ±0.3 × 10⁻¹⁴ m3 kg−1 Pa−1. The contribution for protonation was taken into account (see text).

