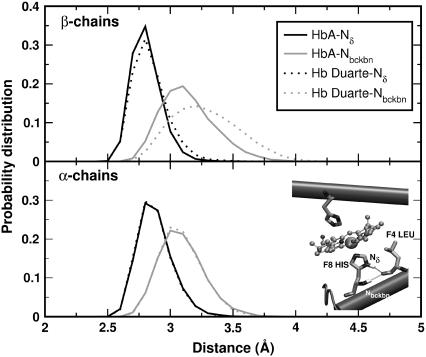
FIGURE 12.
Probability distribution of the distances Nδ(His F8)-CO(Leu F4) (black curves) and Nbckbn(His F8)-CO(LEU F4) (gray curves) for the deoxy Hbs. The solid and dotted curves refer to data for HbA and Hb Duarte, respectively. In the inset, the N ions and the leucine residue involved in the formation of H-bonds are shown.

