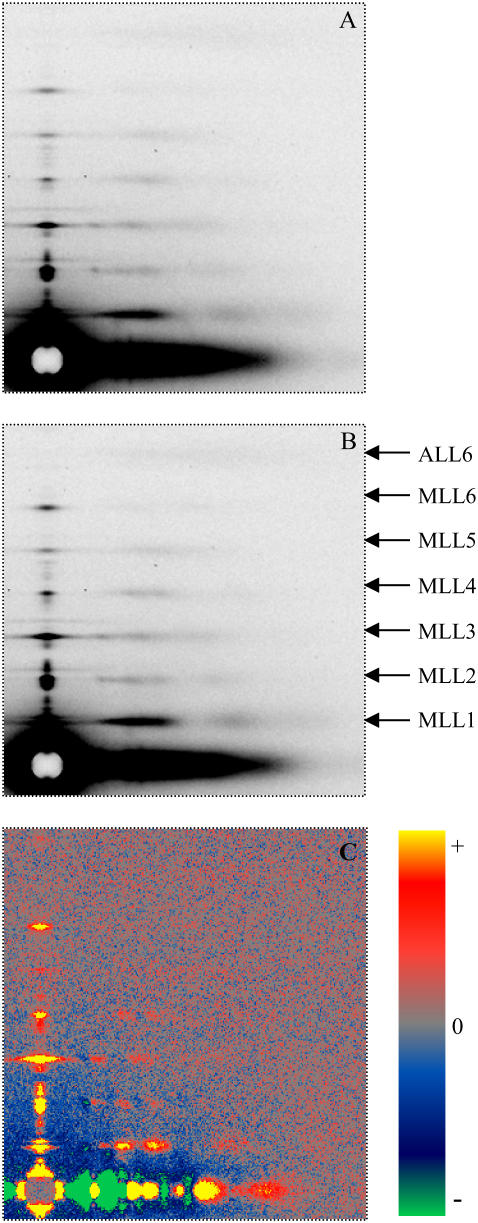
FIGURE 1.
X-ray diffraction patterns from single bundles of permeabilized rabbit psoas muscle fibers in the relaxing solutions. T = 25°C, sarcomere length (SL) = 2.4 μm. (A) Ionic strength μ = 200 mM without PEG and (B) with 5% PEG-1000. (C) The difference pattern obtained from subtracting A from B, showing the intensity increase of the myosin layer lines. The side bar indicates the color scale for gains and losses of intensities. The difference in intensities could not be caused by a change in scattering volume because the x-ray beam covered the entire width of the muscle despite changes in the lattice dimension (see Methods). The original patterns were obtained using the synchrotron radiation beamline X-27c at National Synchrotron Light Source, Brookhaven National Laboratory. The patterns A and B were averaged from three sets of data, each from a single bundle. The exposure time for each pattern was 2 min.

