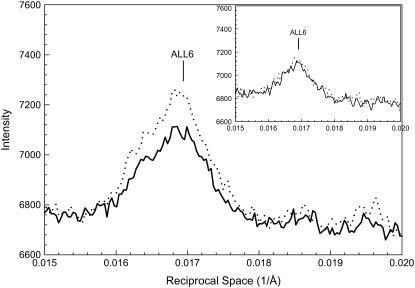
FIGURE 10.
Profiles of intensity in a vertical slice of the sixth actin layer line from the patterns in Fig. 6. The inset shows the same type of profiles of the patterns obtained from bundles at the nonoverlap SL of 4.2 μm. Solid line, μ = 200 mM; dotted line, μ = 50 mM. The baselines were adjusted to the same background level.

