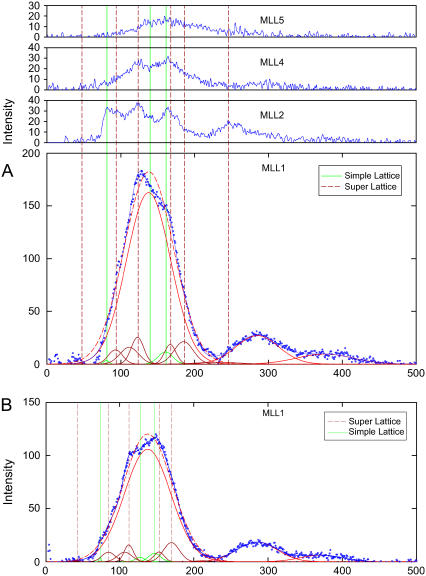
FIGURE 12.
Effects of sampling. (A) Myosin layer lines obtained under relaxing condition at μ = 50 mM. Experimental data are shown in blue dots, which were fitted by one unsampled first myosin layer line (red solid line) plus sampled peaks (dark red and green solid lines). Gaussian functions were used for the fit (see Methods for details). The result of the best fit is shown as the blue solid line. The red dashed line peak is the best fit if lattice samplings are ignored. The peaks are shown at the positions indexed on a mixture of a simple lattice and a superlattice. The three green vertical lines indicate the simple lattice index positions [10], [11], and [20]. The dark dashed red vertical lines indicate the superlattice index positions [10], [20], [21], [31], [40], and [42]. In addition to sampling on the first myosin layer line, samplings on the second and fourth layer lines are clearly indicated. (B) Under relaxing conditions at μ = 200 mM. The first myosin layer line also exhibits the same sampling effect as that in A. The indexed positions of the sampled peaks were adjusted according to changes in the lattice spacing, but the amplitudes were fitted freely. The relative amplitudes of the sampled peaks to unsampled peaks remain approximately the same in A and B. The total sampled intensities on the first myosin layer line were 13% in a versus 12% in b; on the second layer line, 22% in A versus 36% in B. Note that in A and B, the unsampled peak positions of the first myosin layer lines (red solid lines) remained virtually the same, whereas the intensities changed substantially.

