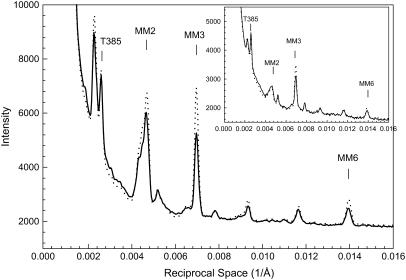
FIGURE 4.
Profiles of intensities along the meridian from the patterns in Fig.1, showing increases in intensities of the myosin-related reflections (MM2 and MM3) and the 385 Å meridional reflection from troponin in the thin filaments (T385). The inset shows the same type of profiles from bundles at SL = 4.2 μm. Solid line, μ = 200 mM without PEG; dotted line, μ = 200 mM with 5% PEG-1000. In the inset, the intensity of T385 reflection decreases with the addition of 5% PEG-1000.

