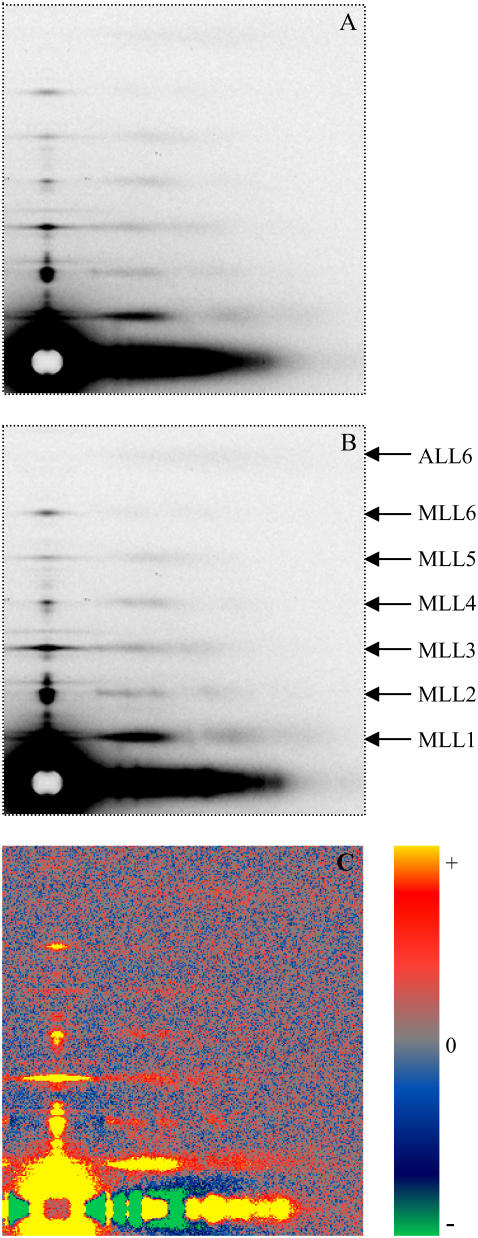
FIGURE 6.
X-ray diffraction patterns from single bundles of permeabilized rabbit psoas muscle fibers in the relaxing solutions. T = 25°C, SL = 2.4 μm. (A) Ionic strength μ = 200 mM; (B) μ = 50 mM. (C) The difference pattern obtained from B subtracted by A, showing the intensity increase of the myosin layer lines. The patterns A and B were averaged from three sets of data, each from a single bundle. The exposure time for each pattern was 2 min.

