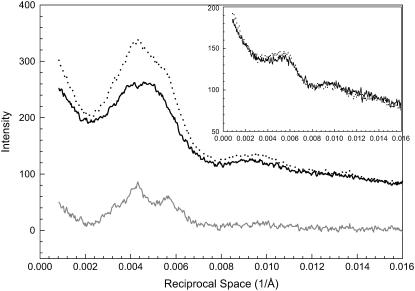
FIGURE 8.
Details of intensity profiles along the first myosin layer lines from the patterns in Fig. 6. The inset shows the same type of profiles obtained from bundles at nonoverlap with SL = 4.2 μm. Solid line, μ = 200 mM; dotted line, μ = 50 mM; gray line, based on the difference pattern of Fig. 6 C. Sampling effects can be seen on the peaks (see section on sampling for detailed analysis).

