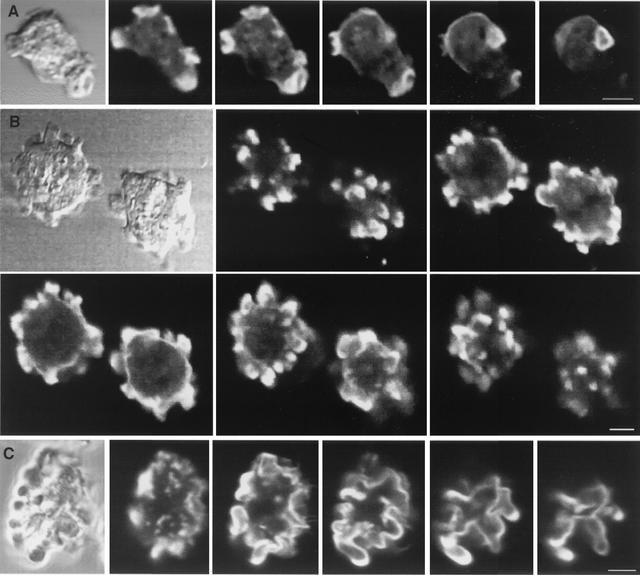
FIG. 7.
Three-dimensional localization of F-actin. Cells were fixed and stained with TRITC-phalloidin, and confocal z sections were acquired. (A) Wild-type cells. Images are shown at 1.4-μm z intervals. (B) V12-RacB cells. Images are shown at 3-μm z intervals. Note that the protrusions on the cell surface are enriched in F-actin. (C) WT-RacC cells. Images are shown at 1.5-μm z intervals. Note that these deformations of the cortex are not actin filled. Bar, 5 μm.

