FIG. 3.
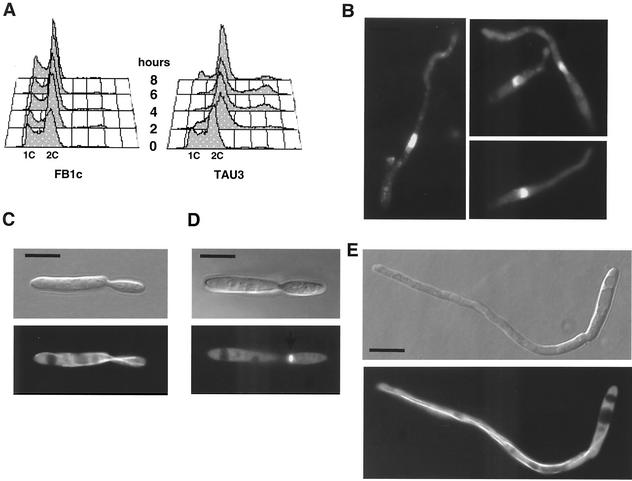
Response to pheromone causes a G2 cell cycle arrest. (A) DNA content of pheromone-responding cells. The control FB1c and tester TAU3 cells were incubated in the presence of a1 synthetic pheromone as described in the text. Samples were removed at 0, 2, 4, 6, and 8 h, and the DNA content was measured by FACS analysis. Relative fluorescence intensities are given on the horizontal axes, indicating the 1C and 2C DNA contents. The adhesiveness of cells forming conjugative tubes produces a small peak corresponding to 4C DNA content. (B) DAPI staining of TAU3 cells producing conjugation tubes after incubation in the presence of pheromone. Note the presence of a single uncondensed nucleus per cell, which is typical of G2 phase. (C) Nomarski (top) and epifluorescence (bottom) images of cells of TAU50, a pheromone-responsive strain carrying a CFP-α-tubulin fusion, grown in the absence of pheromone, showing the typical morphology and microtubule organization at G2 phase. (D) Same cell as in panel C but at the onset of mitosis, where the spindle is present near the neck area. (E) Pheromone-treated TAU50 cell developing a conjugative tube. Note that the microtubule organization of the cell is similar to that present at G2 phase. Bars, 5 μm.

