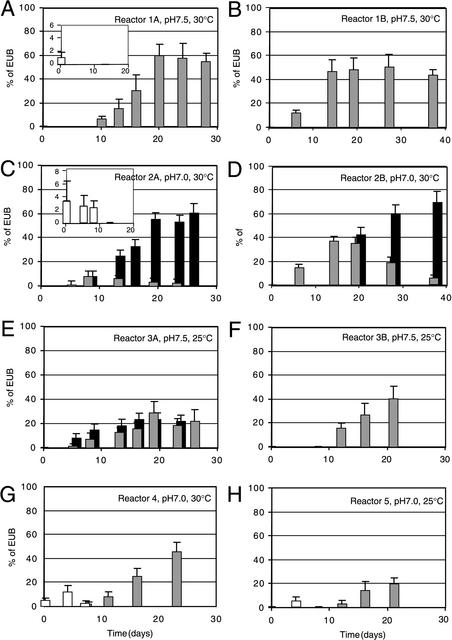
FIG.2.
Community composition development of ammonia and nitrite oxidizers in the different reactors during operation time. Panels correspond to those in Fig. 1 and 3. Shown are relative biovolumes of FISH probe-stainable groups compared to the biovolume taken up by the biomass stainable with the EUB probe mixture (% of EUB). Probes used for quantitation were NEU (grey bars), which targets several halophilic and halotolerant members of the genus Nitrosomonas; Nso190 (black bars), representative for many but not all ammonia-oxidizing bacteria from the β-subgroup of Proteobacteria; and Ntspa662 (white bars), specific for all members of the genus Nitrospira. Since we observed that the fluorescence intensities obtained with Nso1225 were weaker than those obtained with Nso190, we decided not to use Nso1225 for quantitative FISH. When visual inspection indicated that all aggregates were stained with NEU, no specific FISH with Nso190 was performed (as in panels A, B, F, G, and H), except for reactor 3A, which was used to confirm that in such a case NEU- and Nso190-based counts were the same. Note that in some instances the population sizes were detectable but appear as very small bars on the scale (e.g., days 0, 6, and 8 in some reactors). The inset in panels A and C shows the Nitrospira populations on an enlarged scale. Note the different time axes in panels B and D.

