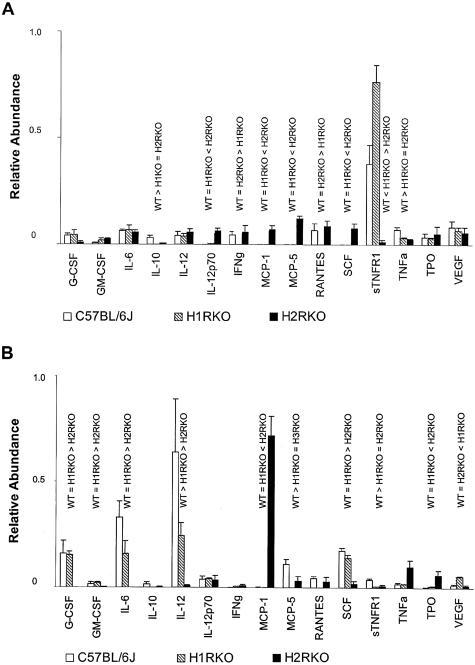
Figure 6.
Cytokine production by PE macrophages from unimmunized (A) and MOG35-55-immunized (B) C57BL/6J, H1RKO, and H2RKO mice. Assays were performed using pooled cells from two to three mice per experiment. The results presented represent the average of four independent experiments and the data are expressed as the normalized average relative abundance ± SEM. Analysis of variance was used to evaluate the significance of differences in cytokine levels among the three strains followed by a Tukey’s multiple comparison test to determine the significance of differences between strains when warranted. For all analyses, significance was determined at P ≤ 0.05. Unimmunized: G-CSF (F = 1.80, P = 0.18); GM-CSF (F = 1.84, P = 0.18); IL-6 (F = 3.43, P = 0.05); IL-10 (F = 5.14, P = 0.02); IL-12 (F = 2.48, P = 0.11); IL-12p70 (F = 16.88, P < 0.001); IFN-γ (F = 6.71, P = 0.006); MCP-1 (F = 14.39, P < 0.001); MCP-5 (F = 83.6, P < 0.001); RANTES (F = 3.88, P = 0.03); SCF (F = 11.06, P = 0.001); sTNFR1 (F = 30.6, P < 0.001); TNF-α (F = 2.84, P = 0.08); TPO (F = 0.74, P = 0.49); VEGF (F = 0.82, P = 0.46). Immunized: G-CSF (F = 6.50, P = 0.006); GM-CSF (F = 4.31, P = 0.03); IL-6 (F = 8.81, P = 0.002); IL-10 (F = 3.52, P = 0.05); IL-12 (F = 4.64, P = 0.02); IL-12p70 (F = 0.05, P = 0.95); IFN-γ (F = 1.52, P = 0.24); MCP-1 (F = 8.17, P = 0.002); MCP-5 (F = 11.69, P < 0.001); RANTES (F = 3.12, P = 0.07); SCF (F = 6.45, P = 0.006); sTNFR1 (F = 7.26, P = 0.004); TNF-α (F = 4.05, P = 0.03); TPO (F = 5.39, P = 0.01); VEGF (F = 17.45, P < 0.001).

