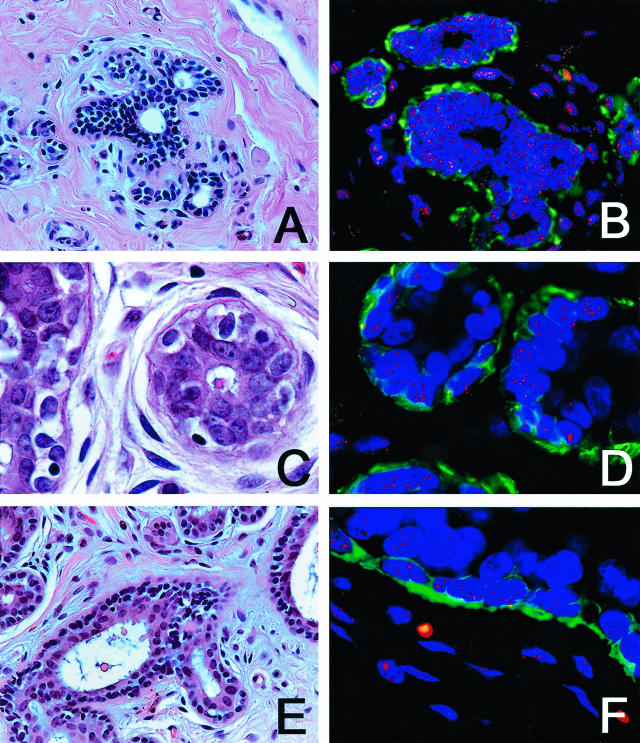
Figure 1.
H&E staining (A, C, E) and TELI-FISH (B, D, F) analysis of telomere length in normal breast TDLU. A and B: Note that the secretory cells (negative with the green actin stain, facing the lumen) have comparable intensity of telomere signals as the ME cells (actin-positive). C and D: Note that the secretory cells in this TDLU have far less intense telomere signals that the ME cells. E and F: Note the variation in telomere signals among the secretory cells in this TDLU.

