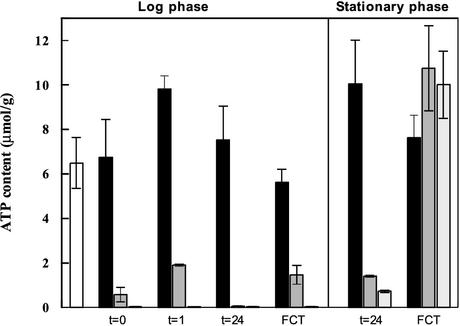
FIG. 4.
Intracellular ATP contents of log- and stationary-phase cells of strain A before starvation (open column), during nitrogen starvation (black column) or carbon starvation with the addition of 0.1 g of glucose per liter (grey column), and during carbon starvation (light grey columns). t = 0 was measured immediately after harvest, t = 1 and t = 24 were measured after 1 and 24 h, respectively, of starvation, and the fermentative capacity was measured 1 h after addition of glucose with the fermentative capacity test (FCT). Error bars indicate minimum and maximum values from two independent experiments.

