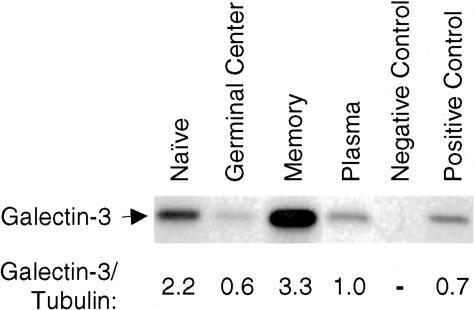
Figure 3.
Galectin-3 protein levels at distinct stages of B-cell development. Western blot analysis of MACS isolated B-cell populations from human tonsil probed with galectin-3 antiserum. The levels of galectin-3 expression were determined by densitometry and normalized to the densitometry-determined tubulin expression level (data not shown) for each population. Equal protein loading was confirmed with a Coomassie Brilliant Blue gel stain (data not shown). Negative and positive controls are galectin-3-negative Raji BL cells and a galectin-3 expressing Raji BL transfectant clone, respectively. Sorted phenotypes of the B-cell populations under study were naïve (CD3−/CD27−/IgD+), GC (CD10+/IgD−), memory (CD10−/CD27+/IgD−) and plasma (CD138+) B cells.

