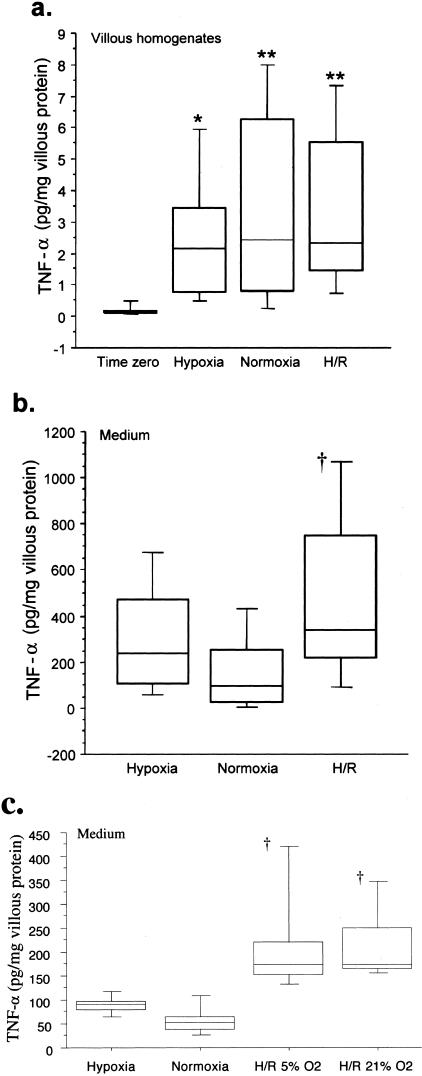
Figure 3.
TNF-α levels in villous homogenates (a), in the conditioned medium (b) after 7 hours of incubation under hypoxia, normoxia, or standard H/R, and in the conditioned medium (c) following reoxygenation under 5% O2 and 21% O2. Central bars represent median values; boxes represent interquartile ranges; and whiskers represent the 90th and 10th percentiles. *, P < 0.05; **, P < 0.01, compared with time 0; †, P < 0.05, compared to normoxia. Fourteen placentas were studied for (a) and (b), and six placentas for (c).

