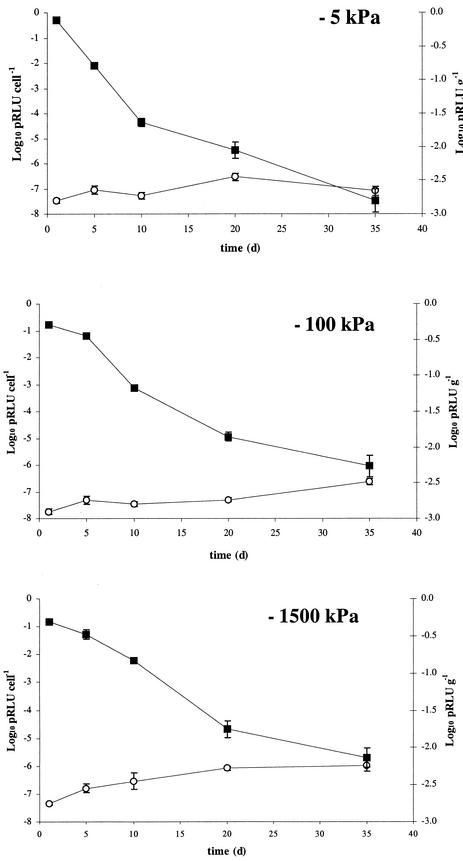
FIG. 6.
Corresponding values (to the cell numbers in Fig. 5) of potential luminescence (▪) and luminescence per cell (○) in microcosms of Insch soil at 15°C and matric potentials of −5, −100, and −1,500 kPa, spiked with a culture of chromosomally lux-marked E. coli O157:H7. Data shown are for the first 35 days, as potential luminescence dropped below the detection limit after this time point. Data represent the mean of three replicates ± standard deviation.

