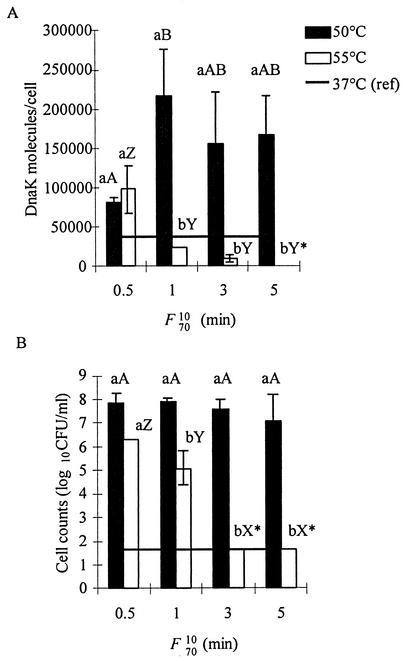
FIG. 1.
Intracellular DnaK concentration (A) and surviving-cell counts (B) of E. coli ATCC 25922 cells exposed to heat treatment of various intensities (F7010). The concentrations per cell were calculated with the number of cells present before the treatment. (A) Horizontal line indicates the DnaK level found in cells during exponential growth (OD600 = 0.5) at 37°C (38,500 molecules/cell). (B) Horizontal line indicates the cell count detection limit. The experiment was repeated three times. Bars represent the mean plus or minus standard deviation. For a specific process lethality value, results with a similar lowercase letter are not significantly different. Capital letters are used for a specific temperature, i.e., AB for 50°C and XYZ for 55°C. Results below the detection level are indicated by an asterisk.

