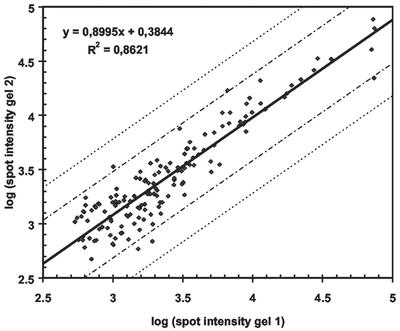
FIG. 2.
Double-logarithmic plot showing the reproducibility of two independent protein extractions and 2-D analyses of L. monocytogenes EGDe total protein isolation procedures. The logarithms of the spot intensities are plotted, and the regression line and R2 value are shown. The two sets of dashed lines indicate 2.5- and 5-fold differences in intensity.

