
Figure 2. Relative quantification of gene expression.
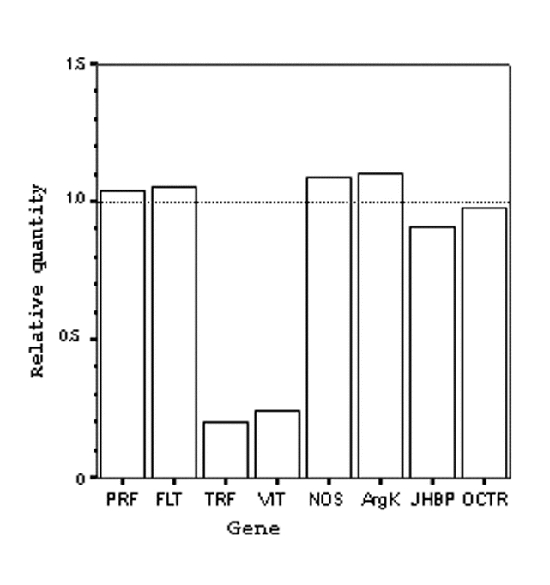
The expression levels of eight candidate genes in Apis mellifera as estimated using real-time quantitative PCR. Relative quantities are normalized to an endogenous reference gene (S8, see text). Note that vitellogenin (VIT) and transferrin (TRF) are down-regulated following CO2-induced changes in reproductive state. Relative quantities represent an average from three assays of a single group of 8 individuals.