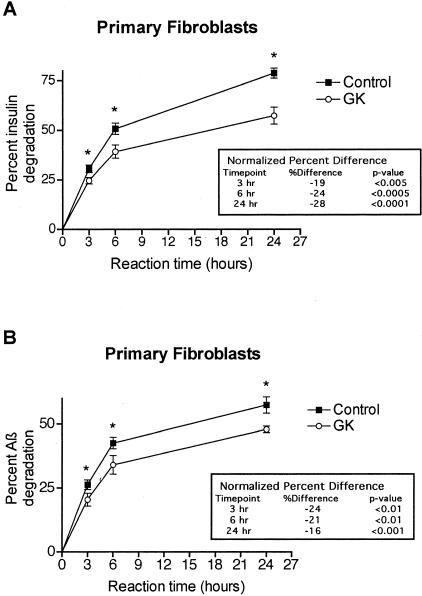
Figure 1.
Insulin and Aβ proteolysis in primary fibroblast cultures of WT control and GK rats. Intact fibroblasts from two GK and two WT rats were incubated in serum-free medium with 40 pmol/L of either human 125I-insulin (A) or human 125I-Aβ1-40 (B). At the indicated times, degradation was quantified by TCA precipitation assays and reported as the percentage of radiolabeled substrate degraded. Graph points represent means, and error bars indicate SEM of 12 determinations (duplicate cultures from each of two rats analyzed in three independent assays; *, P < 0.01). The inset tables show the percent decrease in the GK proteolysis compared to the WT control at each time point after normalization to the mean WT percentage degradation in each assay and then combination of the data sets.

