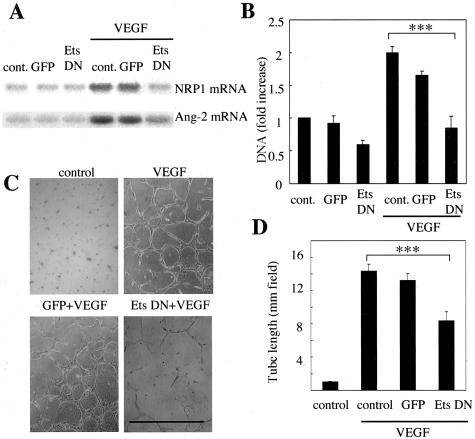
Figure 5.
Effects of Ets-1 blockade on angiogenic activity in BRECs. A: Effects of Ets-1 blockade on neuropilin-1 (NRP1) and angiopoietin-2 (Ang-2) expression. BRECs were infected with adenovirus vector encoding dominant-negative Ets-1 (Ets DN) or adenovirus with the genome carrying an enhanced GFP followed by stimulation with VEGF (25 ng/ml) for 4 hours. Northern blot analysis was performed. Representative Northern blots were shown; top, neuropilin-1 mRNA expression; bottom, angiopoietin-2 mRNA expression. Similar data were obtained from another Northern blot analysis (data not shown). B: The cell growth was analyzed by DNA concentrations measured by a fluorometer. BRECs were incubated with vehicle (PBS), or infected with adenovirus encoding dominant-negative Ets-1 (Ets DN) and GFP, followed by incubation in the medium with or without VEGF (10 ng/ml). After 4 days of incubation, the cells were lysed in 0.1% sodium dodecyl sulfate and DNA concentrations were measured. Results are shown as fold increases of control. ***, P < 0.001. C: Effects of Ets-1 blockade on in vitro tube formation. BRECs were seeded in a three-dimensional collagen gel and incubated with VEGF (25 ng/ml) for 5 days. Total lengths of tube formation of each well were measured and tube lengths (mm/field) were compared. Representative phase-contrast micrographs of tube formation in three experiments; top left, control; top right, VEGF stimulation; bottom left, adenovirus encoding GFP transfectants with VEGF; bottom right, adenovirus encoding dominant-negative Ets-1 transfectants (Ets DN) with VEGF. D: Results are shown as tube length. Mean ± SEM of three separate experiments (each in triplicate). ***, P < 0.001. Scale bar, 1 mm (C).

