
Figure 1.
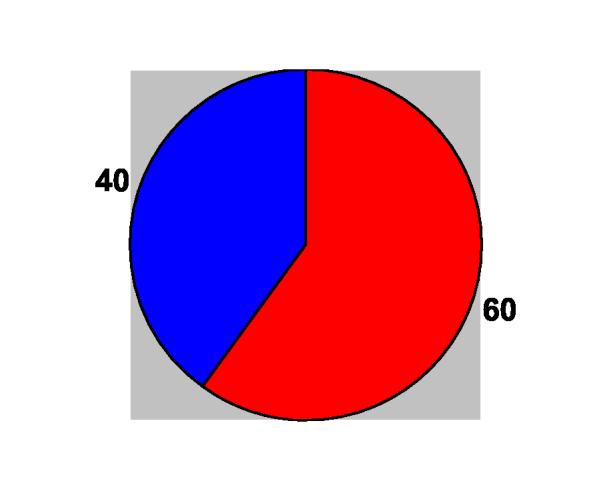
Relative influence* of type of treatment versus efficacy on participants' treatment choices.
Legend:
Blue = Relative influence of efficacy (decrease in risk of fractures over five years)
Red = Relative influence of type of treatment
* Relative influences sum to 100.