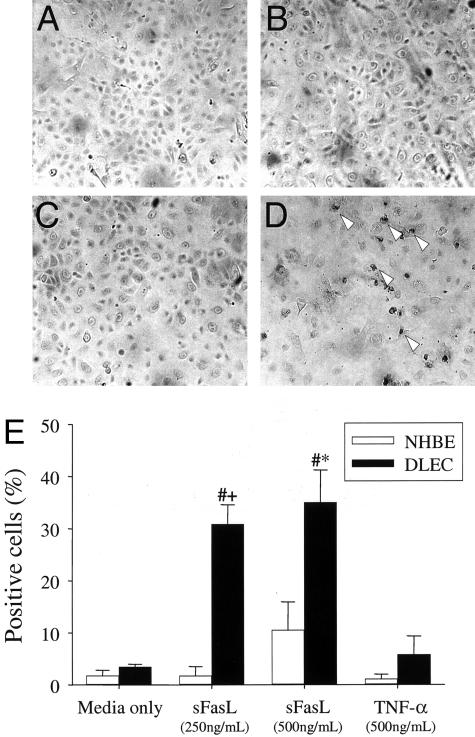
Figure 4.
DNA nick-end labeling assay findings in NHBE (A and B) and DLECs (C and D) incubated with media only (A and C) or sFasL 250 ng/ml (B and D). Arrowheads show some representative positive cells. The percentage of positive cells is shown in E (means ± SEM of three separate experiments). #, P < 0.05 compared to DLEC, media only; *, P < 0.05 compared to NHBE.

