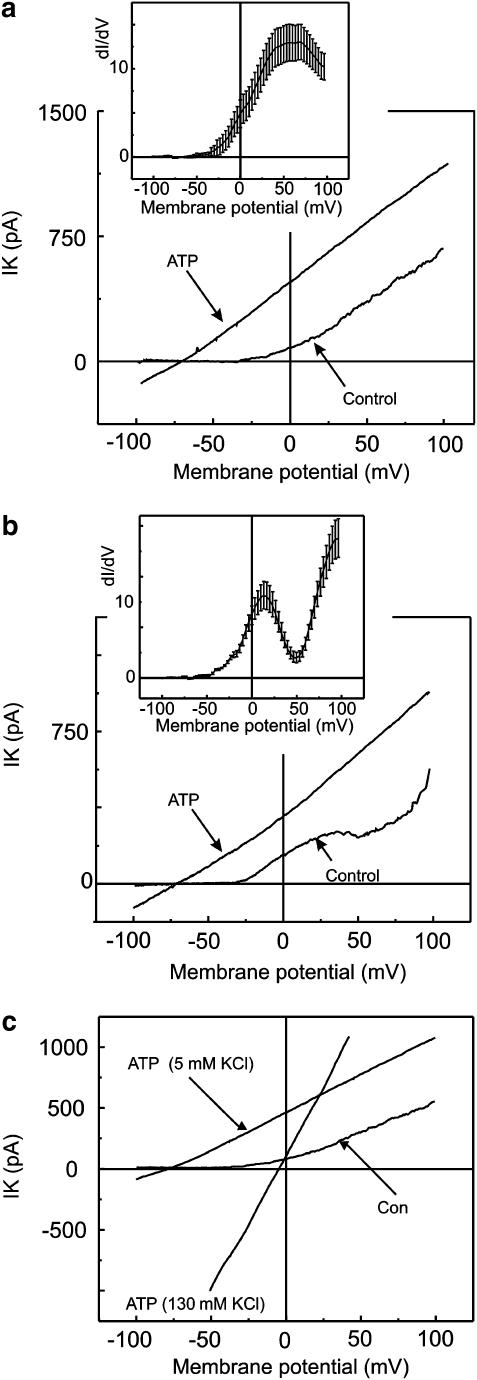
Figure 2.
Effect of ATP on two types of identified mouse aortic smooth muscle cells. Membrane currents were evoked by linear voltage ramps varying from −100 mV to 100 mV from a holding potential of −60 mV. (a, b) Two types of cells under control conditions that differ one from another by their current voltage relations and their conductivity plots. (a) Represents S-type cells. Conductivity plots were obtained from the currents evoked by ramps in 10 individual cells in control conditions. Then the mean conductivity plot was produced and fitted with a single-order Boltzmann function. (b) Represents N-type cells. Conductivity plots were obtained from the currents evoked by ramps in 10 individual cells in control conditions. The mean conductivity plot was obtained from the data set and was fitted with a second-order Boltzmann function. Conductivity plots, the derivative of the current to voltage, are presented in the insets of (a) and (b) and represent the mean±s.e.m. (see text). (c) Represents current voltage relations of the delayed ATP-elicited current at the plato of the sustained activation recorded in asymmetrical K+ concentration and after the reperfusion of the smooth muscle cell with 130 mM KCl.

