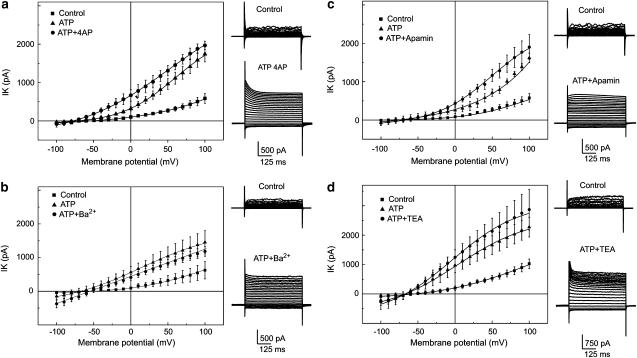
Figure 3.
Effect of 4-AP, Ba2+, TEA and apamin on delayed ATP-elicited outward current. Experiments were performed in a perforated patch clamp configuration. Current voltage relations represent mean±s.e.m. (obtained from six to 10 individual cells) amplitude of the control current (filled squares), delayed ATP-elicited outward current (filled circles) and tested blockers (filled triangles). K+ currents were evoked by voltage step pulses from −100 mV with a step increment of 10 mV. Holding potential was −60 mV. Families of superimposed current traces represent examples of the recording obtained under control conditions and after the application of ATP plus an inhibitor. (a) Mean±s.e.m. current voltage relations obtained at control conditions, under the plateau phase of the ATP-elicited response (250 μM) and after the application of 4AP (2 mM). (b) Mean±s.e.m. current voltage relations obtained at control conditions, under the plateau phase of the ATP-elicited response (250 μM) and after the application of Ba2+ (200 μM). (c) Mean±s.e.m. current voltage relations obtained at control conditions, under the plateau phase of the ATP-elicited response (250 μM) and after the application of apamin (2 μM). (d) Mean±s.e.m. current voltage relations obtained at control conditions, under the plateau phase of the ATP-elicited response (250 μM) and after the application of TEA (2 mM).

