Figure 4.
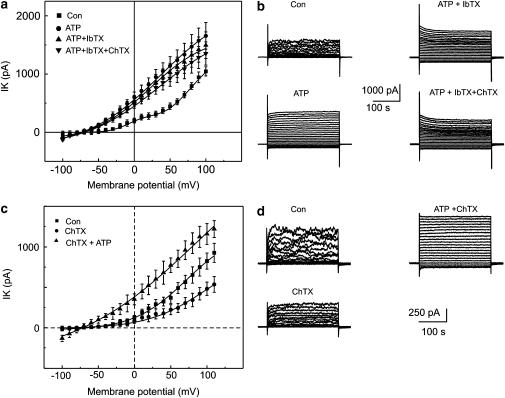
Effect of charybdotoxin and iberiotoxin on the delayed ATP-elicited current. Experiments were performed in a perforated patch clamp configuration and shown in (a) and (b). (a) Mean±s.e.m. amplitude of the currents in control conditions (filled squares), and after extracellular administration of ATP (250 μM) (filled circles), was plotted against the corresponding voltage. The effect of the cumulative application of iberiotoxin (100 nM) is demonstrated by filled right side up triangles and of charybdotoxin by filled upside down triangles, respectively. (b) Superimposed traces of the currents evoked during voltage step pulses applied from a holding potential of −60 mV with 10 mV increments between −100 and 100 mV. Experiments and recordings presented in (c) and (d) were performed in a whole-cell configuration. Cells were dialyzed and bathed in solutions containing 2 mM EGTA (0 mM Ca2+). (c) Mean±s.e.m. current amplitude in control conditions (filled squares), and after the application of charybdotoxin (100 nM) (filled circles), was plotted against the corresponding voltage. The effect of the cumulative application of ATP (250 μM) is illustrated by filled triangles. (d) Superimposed traces of currents evoked by voltage step pulses applied from a holding potential of −60 mV with 10 mV increments between −100 and 100 mV.

