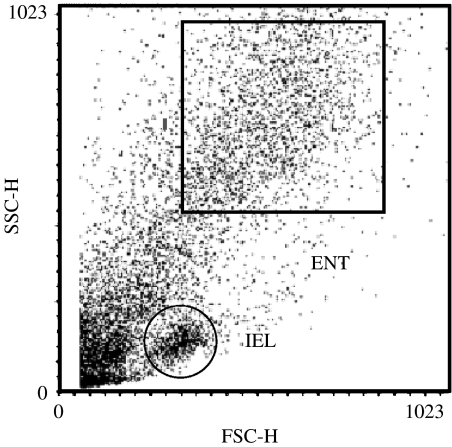
Figure 1.
Representative dot-plot profile of villus intestinal epithelial cells isolated from the proximal small intestine of the Lewis rat. The forward scatter of light (FSC-H) is a measure of increasing cell size and the side scatter of light (SSC-H) is a measure of increasing cell granularity (values are in arbitrary units). The box, ENT, represents enterocytes and all binding experiments were conducted from cells within this region. IEL: intraepithelial lymphocytes.

