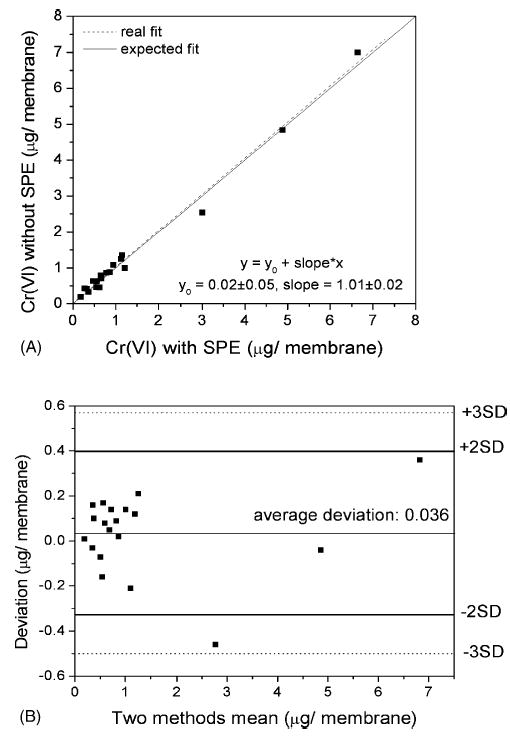
Fig. 2.

(A) Correlation between the Cr(VI) concentrations determined with and without SPE in the environmental air samples, also showing the function of the fit with the values of the intercept with y-axis (y0) and slope. The expected fit is y = x. (B) Bland–Altman graph in which the “two methods mean” is the average of the values measured with and without SPE, and “deviation” the difference between these values. The figure also shows the lines representing ± 2 S.D. (—) and 3 S.D. (…).
