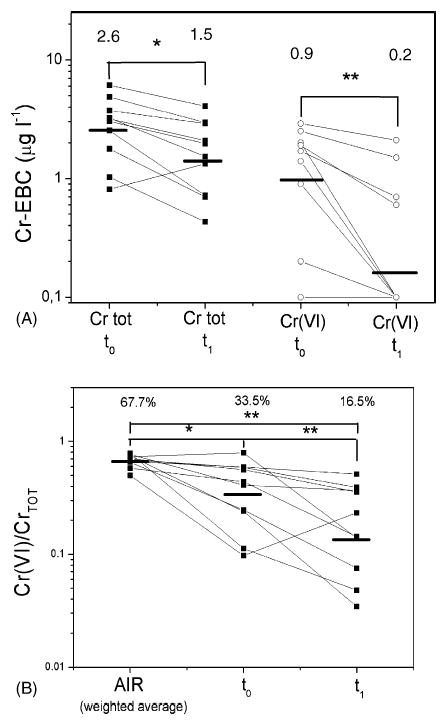
Fig. 4.

(A) Cr and Cr(VI) levels at the end of the Tuesday work shift (t0) and at the beginning of the Wednesday work shift (t1), and their geometric means (top of the graph). (B) The fraction of Cr(VI) in the environmental samples (AIR) at t0 and t1, and their geometric means (top of the graph). *p < 0.05; **p < 0.05 with a paired Student’s t-test (A) and repeated measures ANOVA followed by Tukey’s post hoc tests (B).
