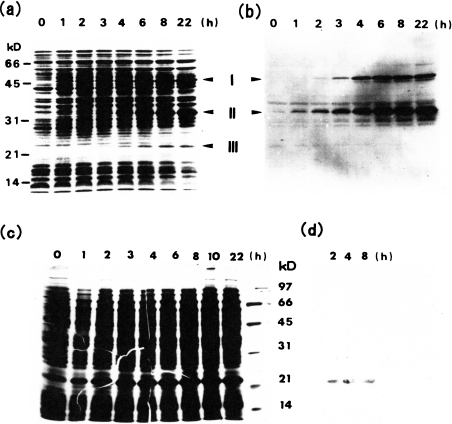
Figure 1. Time course of processing of the wild-type Copia Gag precursor expressed in E. coli with pEC1 (a and b) and that of expression of the 23 kDa protein (Copia proteinase) in E. coli with pEC3 (c and d) as analysed by SDS/PAGE (a and c) and Western-blot analysis (b and d).
At the indicated times after addition of isopropyl β-D-thiogalactoside, the cells (2×10⁷) were lysed in 10 μl of the lysis buffer, and the resulting lysates were submitted to SDS/PAGE (a, c) and immunoblot analysis using an anti-VLP serum (b) or an anti-serum against the 23-kDa protein obtained from E. coli with pEC1 (d). Approximate molecular masses are also shown for the standard marker proteins phosphorylase b (97.4 kDa), BSA (66.2 kDa), ovalbumin (45.0 kDa), carbonic anhydrase (31.0 kDa), soybean trypsin inhibitor (21.5 kDa) and lysozyme (14.4 kDa). kD=kDa.

