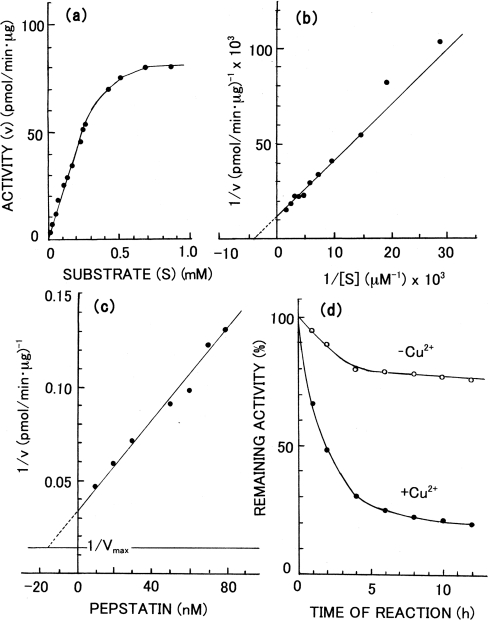
Figure 4. Effects of substrate concentration and inhibitors on the activity of Copia proteinase.
(a) The initial rates of hydrolysis were measured at various concentrations of substrate. (b) Lineweaver–Burk plot of the data in (a). (c) Dixon plot for pepstatin inhibition. (d) Time courses of changes in activity by reaction with DAN were measured in the presence (●) or absence (○) of 1 mM Cu2+.

