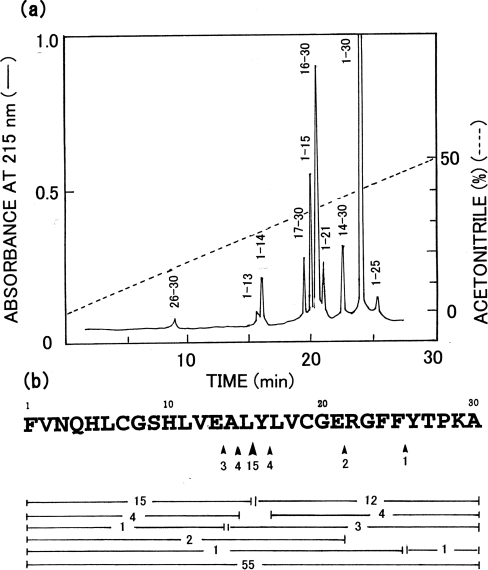
Figure 6. Cleavage specificity of Copia proteinase toward oxidized insulin B-chain.
(a) HPLC pattern of a 3 h digest of oxidized insulin B-chain. The numbers against the peaks indicate the residue positions of the peptide in the substrate. (b) Yields of peptides and sites of cleavage. Arrowheads indicate the cleavage sites, and the number under each arrowhead shows estimated extent of cleavage as a percentage. Bars indicate peptide fragments produced, and the number in the middle of each bar shows the percentage yield of the peptide.

