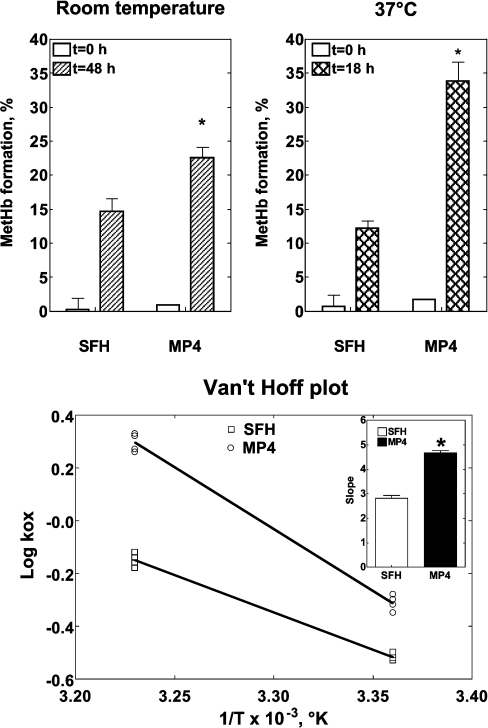
Figure 1. Autoxidation of SFH and MP4.
Upper panel: autoxidation of SFHb and MP4 at room temperature (20–22 °C; left panel) and 37 °C (right panel). Experiments were performed with four different preparations of each Hb type with a Hb concentration of 0.06 mM in PBS with 0.1 mM EDTA (pH 7.3). P<0.0001 (as determined by ANOVA) for both temperatures. *P<0.001 compared with SFHb (determined by the Bonferroni multiple comparison test). Lower panel: a Van't Hoff plot of the data shown in the upper panel, with the kox reported as a function of 1/°K. The inset shows the slopes of the regression lines separately for SFHb and MP4. *P<0.001 compared with SFHb (Student's t test).

