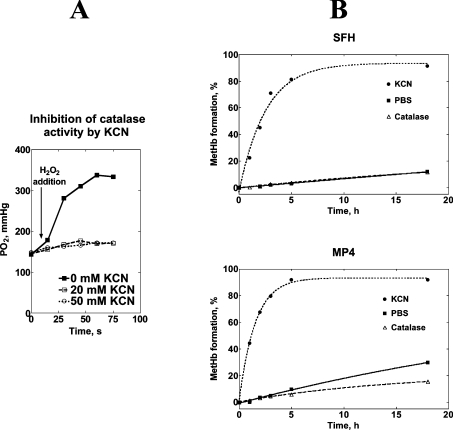
Figure 2. Rates of autoxidation of SFH and MP4 in the presence and absence of catalase.
The left panel (A) shows the inhibition of catalase activity by KCN. pO2 was measured in an anaerobic cell containing 2 ml PBS and 0.1 ml catalase (final nominal activity 1000 units/ml). The reaction was started by adding 5 μl of 3% H2O2 (arrow) and pO2 was monitored for an additional 60 s at 37 °C. The reaction was performed at KCN concentrations of 0, 20 and 50 mM. The right panel (B) shows the autoxidation of SFHb and MP4 in the presence of PBS only (■), 1000 units/ml catalase (△) and 50 mM KCN (●). Best fit lines were obtained as explained in the text, and Table 1 reports the values of the rate constants.

