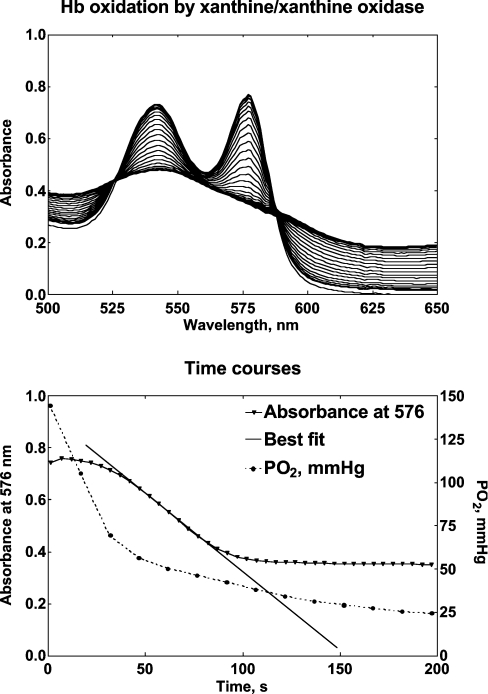
Figure 3. Hb oxidation by the xanthine/xanthine oxidase system.
The upper panel shows a typical spectral change observed when 0.1 mM Hb in 50 mM potassium phosphate, 0.5 mM xanthine, 50 mM KCN and 1 mM EDTA (pH 7.3) is exposed to 0.5 units of xanthine oxidase at 37 °C. Spectra were obtained every 5 s. The lower panel shows the absorbance changes recorded at λ=576 nm to measure the maximal oxidation rate. The Figure also shows the decay of pO2 (right axis) when the mixture is reacted in the absence of Hb. The maximal oxidation rate of Hb corresponds to the linear portion of the fall in pO2.

