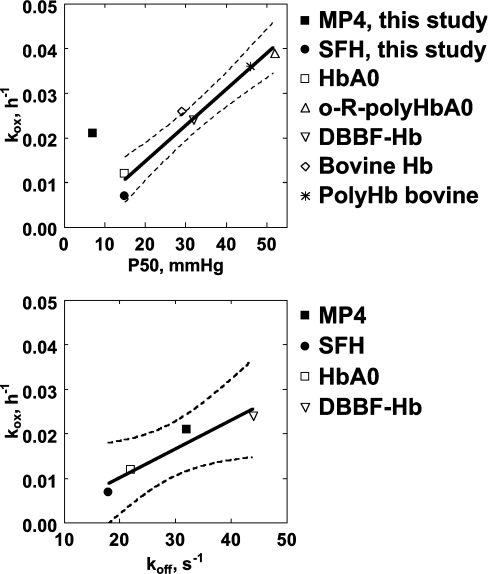
Figure 7. Relationship between autoxidation rates and p50 or oxygen dissociation rate constants.
Upper panel: relationship between the apparent kox and Hb–O2 affinity (p50, i.e. the pO2 at which half of Hb is saturated with oxygen) in various Hb types from the present study and from the literature [7]. The line represents the best linear fit when the point referring to MP4 is excluded from the calculation, with the 95% confidence limits, slope=(0.808±0.085)×10−3, intercept=(1.46±2.928)×10−3, P=0.0007. Lower panel: relationship between kox and the rate constant of oxygen dissociation from OxyHb in various Hb types from the literature [34,37]. The line represents the best linear fit when considering all data points, with the 95% confidence limits, slope=(0.648±0.141)×10−3, intercept=(−2.807±4.331)×10−3, P=0.04.

