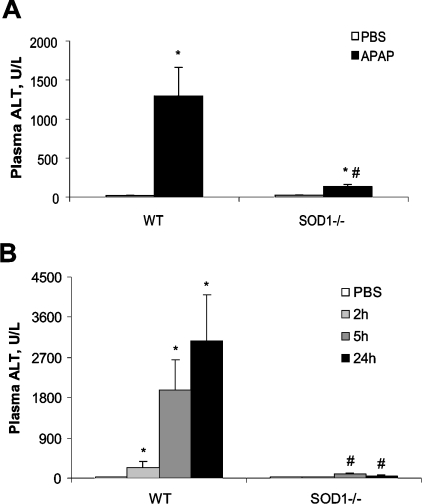
Figure 2. Plasma ALT activity of WT and SOD1−/− mice treated with APAP at various time points.
(A) Mice were injected (i.p.) with PBS or APAP (600 mg/kg) and killed at 5 h after the injection. (B) Mice were injected (i.p.) with PBS and killed immediately after the injection or injected with APAP (300 mg/kg) and euthanized at 2, 5 and 24 h after the injection. In both panels, values are means±S.E.M. (n=6); * indicates the APAP-treatment effect (P<0.05) as compared with the PBS-treated controls within genotypes, whereas ‘#’ indicates the genotype effect (P<0.05) within the same treatment.

