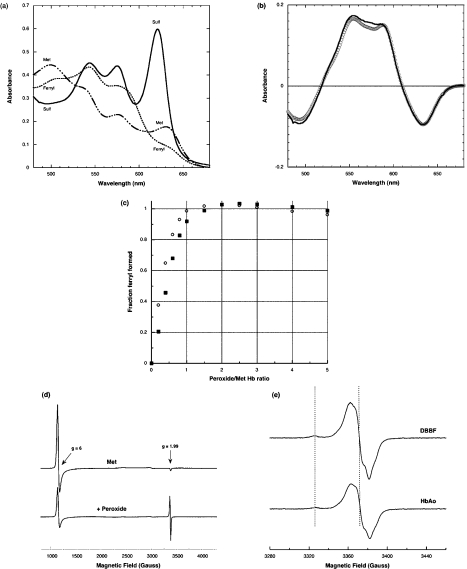
Figure 1. Optical and EPR spectra following peroxide addition to methaemoglobins.
(a) Optical spectra of metHbAo (50 μM) before (Met) and 2 min after (Ferryl) the addition of 100 μM H2O2, with subsequent addition of 2 mM sulfide (Sulf). (b) Difference spectrum (ferryl minus met) for HbAo (−) and Hb–DBBF (○). (c) Titration of ferryl formation (determined from absorbance change at 545 minus 700 nm) against peroxide concentration added, assuming maximum formation at saturating peroxide concentrations (○, Hb–DBBF; ■, HbAo). Experimental conditions: sodium phosphate (50 mM) containing DTPA (diethylenetriaminepenta-acetic acid) (20 μM), pH 7.4, at 37 °C. (d) EPR spectra of metHbAo (50 μM), before and 30 s after the addition of H2O2 (100 μM), in sodium phosphate (50 mM) containing DTPA (50 μM), pH 7.4, at 37 °C. EPR conditions: temperature, 10 K; microwave power, 3.2 mW; modulation amplitude, 4 G; receiver gain, 1×10⁴; microwave frequency, 9.47 GHz; time constant, 81.92 ms; scan rate, 23 G/s. (e) Close up of free radical region of EPR spectra following peroxide addition to metHbAo and metHb–DBBF under experimental conditions identical with those in (d). Illustrated features relate to tyrosine (g=2.005) and tryptophan peroxyl radicals (g=2.033). EPR conditions: temperature, 10 K; microwave power, 12.69 μW; modulation amplitude, 3 G; microwave frequency, 9.47 GHz; receiver gain, 3.99×10⁴; time constant, 81.92 ms; number of scans, 15; scan rate, 2.9 G/s. Total radical concentrations (means±S.D.; n=6): HbAo tyrosine, 1.31±0.09 μM; Hb–DBBF tyrosine, 1.88±0.14 μM; HbAo tryptophan peroxyl, 0.26±0.02 μM; Hb–DBBF tryptophan peroxyl, 0.44±0.03 μM. (P<0.001 for the increase seen in both radicals in the case of Hb–DBBF.)

