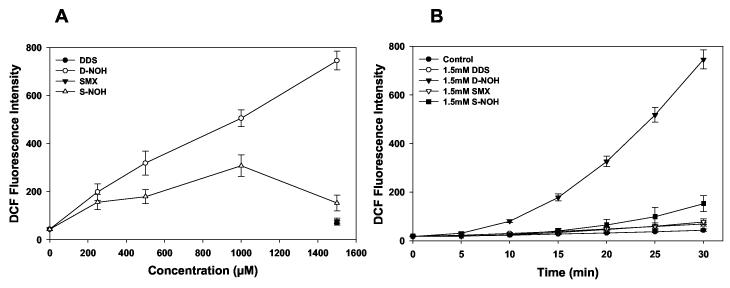
Figure 4.
Reactive oxygen species (ROS) generation in the presence/absence of various drugs and their metabolites in NHDF. NHDF were seeded at a density of 105 cells/mL on a 96 well plate. A) Concentration dependent response. Cells were exposed to increasing concentrations of the hydroxylamine metabolites (S-NOH or DNOH) or parent compounds (DDS-1.5 mM and SMX-1.5 mM) in phosphate buffer. 2',7'-dichlorodihydrofluoroscein-diacetate (DCHF-DA) (20 μM) a fluorescent dye was added immediately. Relative fluorescence intensity at 30 min time point is presented as the mean (SD) of 8 replicate incubations. B) Time dependent response. Cells were exposed to 1.5 mM of parent compound or the metabolite in phosphate buffer. 2',7'-dichlorodihydrofluoroscein-diacetate (20 μM) was added immediately. Relative fluorescence intensity was measured every 5 min for 30 min at an excitation/emission of 485/530. Data shown as mean (+SD) 8 separate incubations.

