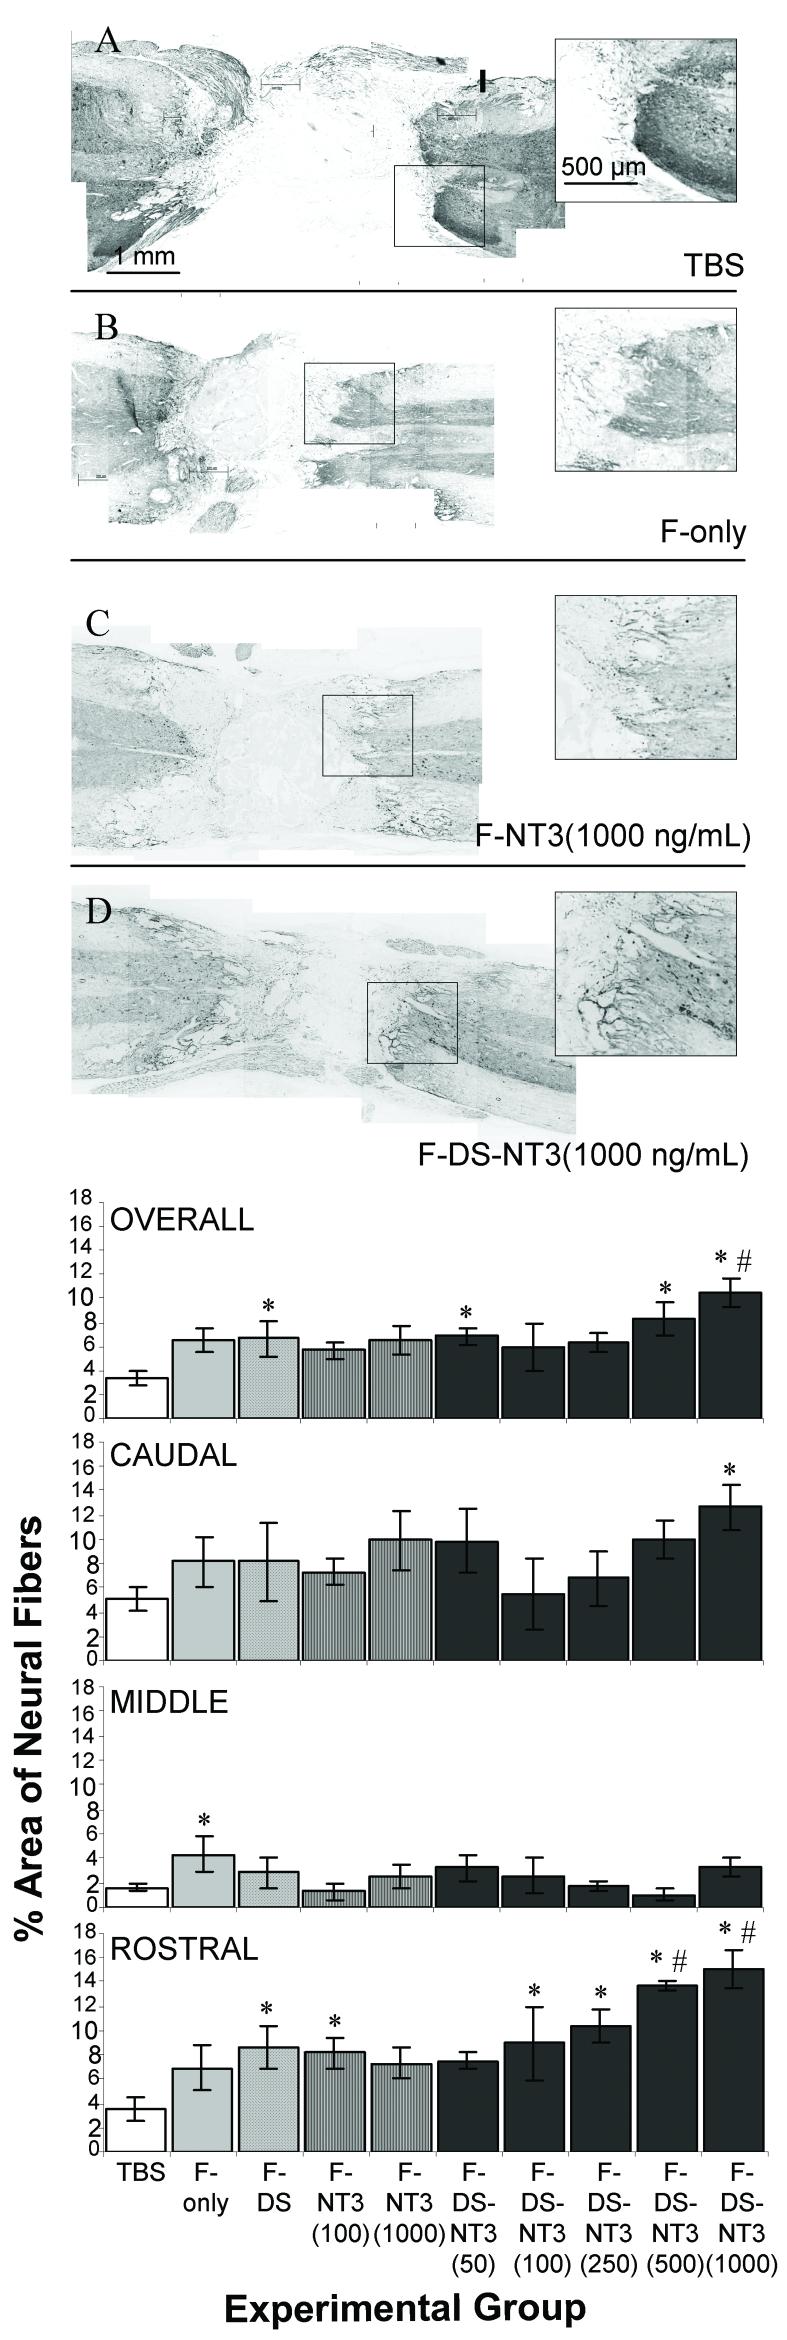
Figure 2.
Effect of controlled delivery of NT-3 from fibrin scaffolds on neuronal fiber sprouting. A-D. Neuronal staining (Tuj1) in spinal cords after treatment with (A) TBS, (B) fibrin (F-only), (C) fibrin and NT-3 at 1000 ng/mL (F-NT3(1000 ng/mL)), and (D) fibrin with the delivery system and NT-3 at 1000 ng/mL (F-DS-NT3(1000 ng/mL)). Horizontal sections, with the rostral cord oriented toward the right. Box indicates area of inset. F-DS-NT-3(1000 ng/mL) treated cords (D) show extensive neural sprouting (inset). E. Density of neuronal fiber sprouting in lesion areas of injured spinal cords in the whole lesion (overall) and in the caudal, middle, and rostral thirds of the lesion. * denotes p<0.05 vs. TBS group. # indicates p<0.05 vs. F-NT-3(1000 ng/mL) group. Error bars represent standard error of the mean.

